The Client
The client is a 135-year-old American utility giant, generating ~3,500 MW power and catering to ~5.5 million electric customer accounts and 4.5 million natural gas customers. The client needed an innovative solution to accurately forecast inflows into dam in a timely manner, with visualization for better insight and decision-making.
The need for forecast inflow into hydropower dams
There is a growing need for change in the hydropower industry to incorporate inflow forecasting for dam operations. By using forecasts to optimize reservoir management, hydropower generation can be maximized without compromising flood control or dam safety. Forecast-based operations ensure more consistent energy production and enhance the overall efficiency and reliability of hydropower systems.

Challenges
The client, via a contract with Regional County, received a ~60% share of a well-known hydro project. Regional County (DOPD) provided an hour-by-hour forecast of inflows into the dam once a day. DOPD only provided forecasts for the next three days once per day at 7 AM and no additional incentives were provided to them to improve forecasts. Since the forecasts weren’t very accurate, the nearby located dam was impacted by the operations of upstream hydro projects. Some of the challenges included:
- Unnecessary spill: When actual inflows exceeded forecasts, pond levels approached maximum pond limits, triggering spill that could have been avoided, resulting in lost value.
- Ponds approaching maximum limits frequently: Due to this issue DOPD operators reduced the pond operating range.
- Suboptimal generation scheduling, purchases and sales in the day-ahead and real-time markets: An inaccurate forecast provided an inaccurate depiction of the system position. Traders scheduling generation or procuring energy from markets to balance their positions would over- or under-procure energy which was not optimal or economically efficient. When forecasts were consistently inaccurate, traders pursued overly risk-adverse positions given the uncertainty associated with the forecasts.
- Reliability concerns: If water generation was not available when required, the system was at risk of uneconomic dispatch, uninstructed imbalance charges, or even load shedding.
LTIMindtree’s Solution
Track 1: Data science–Identified following potential variables to forecast inflows and created forecast model
Developed a machine learning model to provide a 7-day hourly inflow forecast for the hydro project. Several versions of the forecasting model were developed and tested to compare against DOPD (Regional) forecast, and the most accurate version was finalized and the forecast values referred to as data strategy management (DSM) forecast. The model was:
- More accurate: Achieved a target of 10-15% mean absolute percentage error (MAPE) over 6-8 months for both hourly and daily forecasts.
- Timelier: Updated forecast values hourly to support the operations team in real-time, with forecast values available 75 minutes before each hour.
Data used for machine learning model development
- Weather data
- Hourly actual and forecast data from weather source
- Additional data from locations closer to dams
- MOTR data
- Hourly actual and forecast data (available in MOTR and Snowflake)
- PI data
- Daily/hourly/sub-hourly data for dams
- Locational marginal price (LMP) data
- Historical inflow data for dam
- Snowmelt and precipitation data for the Columbia River basin
- Upstream dam operations data (if available)
Track 2: Data engineering–Load forecasts data into Snowflake
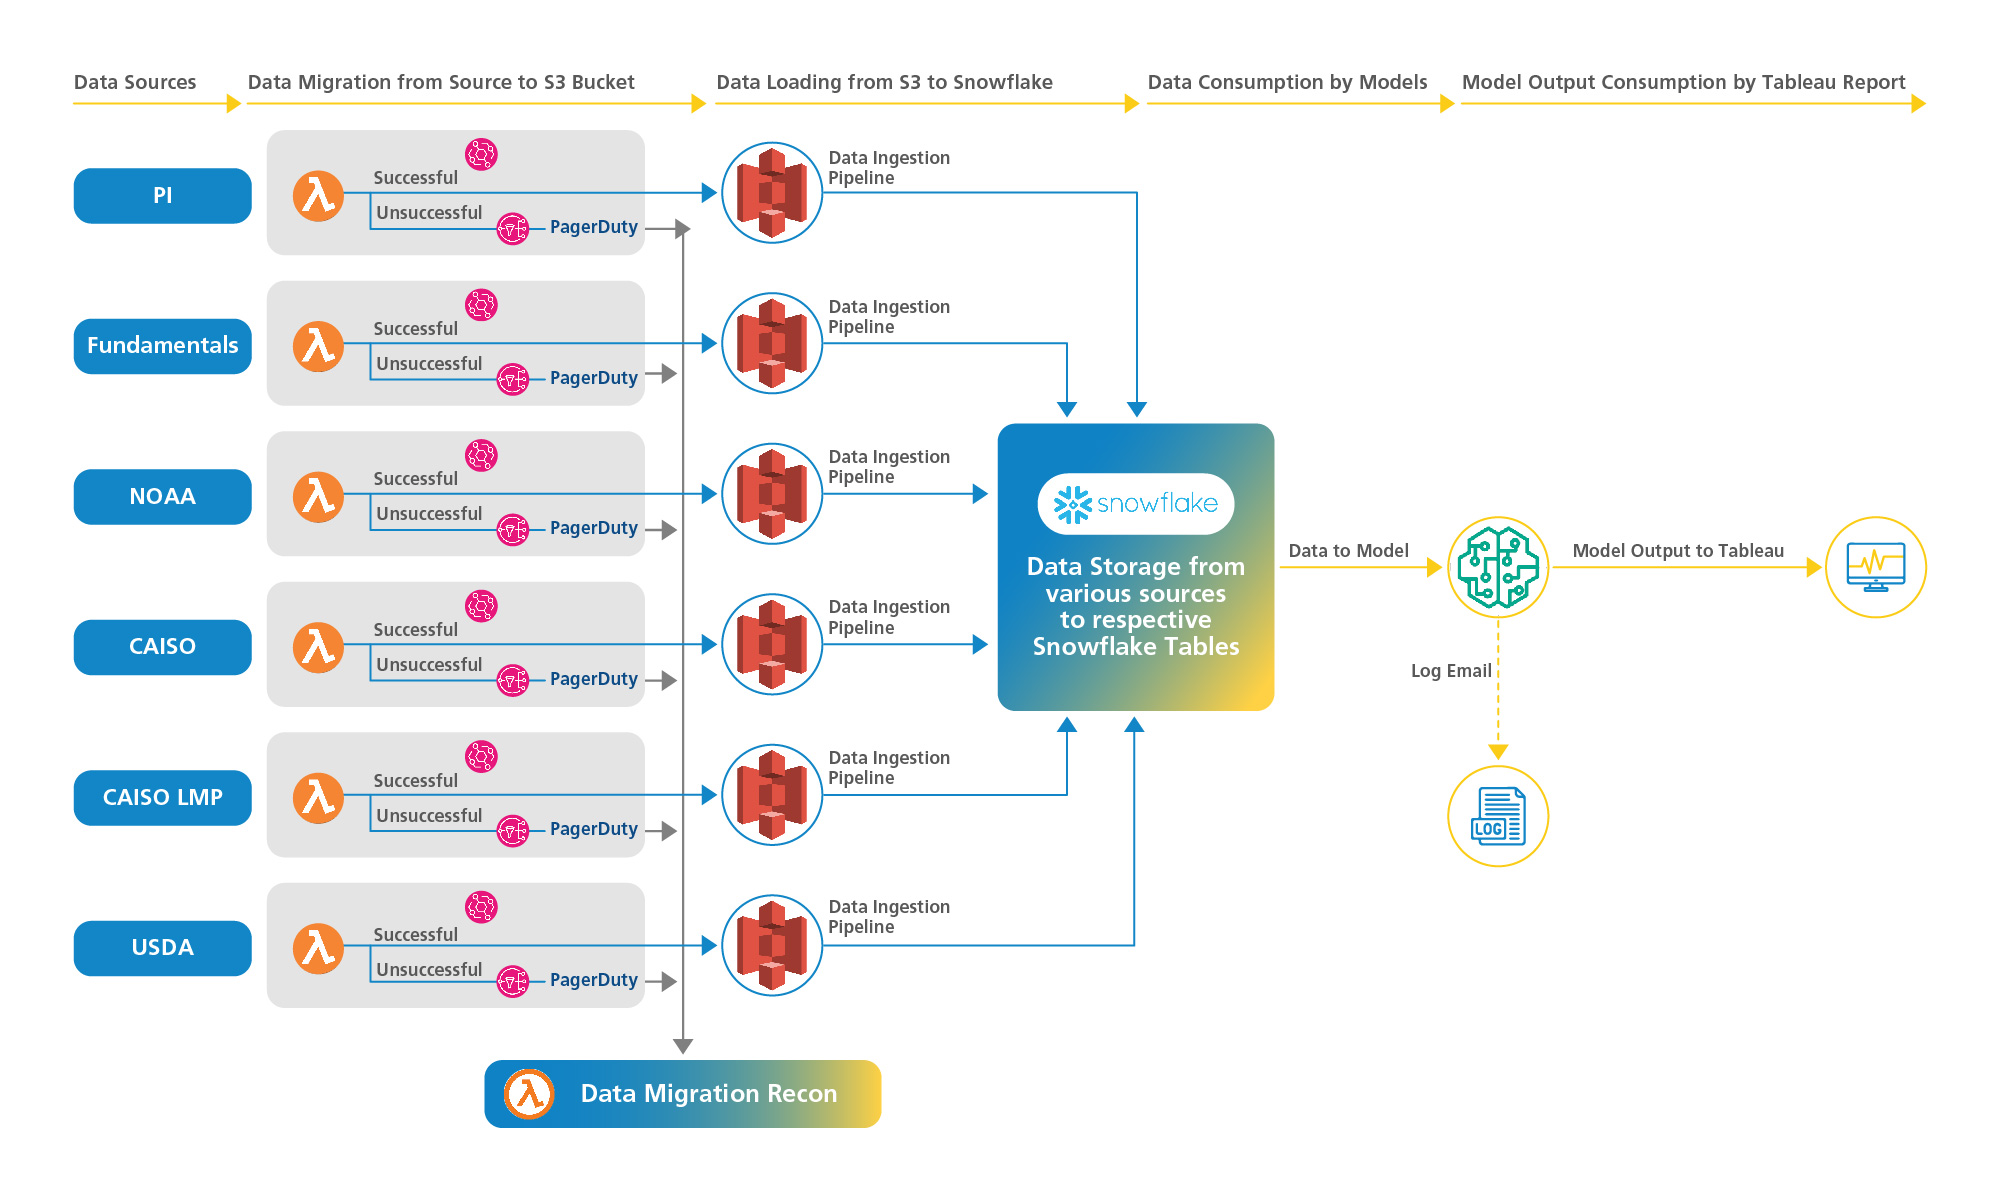
- Ingested data from various sources like PI, California Independent System Operator (CAISO), National Oceanic and Atmospheric Administration (NOAA) and United States Department of Agriculture (USDA) using lambdas. Once the data was in s3, we loaded the data into Snowflake using snow pipes and tasks. The hydro forecast model used this data to predict daily hour-by-hour forecast of inflows for the hydro project.
- The forecast data was loaded back into Snowflake for reporting purposes.
- Created outcomes views to compare MAPE and mean absolute value (MAE) of the DSM hydro forecast model predictions and DOPD (Regional County PUD) predictions.

Figure 1: Solution architecture and design
Track 3: Reporting–Track and monitor performance of DSM forecast vs DOPD forecast (Tableau dashboard)
- Showed hourly and daily mean absolute percentage error (MAPE) and mean absolute error (MAE) vs DOPD MAPE and MAE
- Value of reduced avoidable spill and dollar benefits
Hydro forecast Tableau dashboard
The Hydro forecasting Tableau dashboard was an output of the hydro forecasting project. The goal of the dashboard was to show the details of the DSM forecast, DOPD forecast and actual forecasts along with the MAE and MAPE calculations as explained below. It provided the traders with visibility and a sense of the relative comparisons of both the forecasts with actuals and hence the scale of their variation. Based on the trends on forecasts and actuals on the dashboard, trading and strategy analysts decided to schedule the power generation.
Tech Stack
| Forecasting model | Machine learning, Python |
| Data engineering | S3, Snowflake, Lamda |
| Front end | Tableau |
Benefits
The hydro forecasting solution enabled a wide range of benefits for the client, including:
Conclusion
Our hydro forecasting solution transformed the client’s business, providing faster, more accurate and timelier 7-day hourly forecasts of inflows into the dam. By adopting this model, the client can make timely, data-driven decisions, improve scheduling and bidding in energy markets, and drive cost-saving innovations. Additionally, improving ability to meet regulatory requirements, environmental commitments, better preparedness for high flow events and potential flood management scenarios.
Ready to unlock smarter savings in real-time hydro forecasting?
Reach out to us at eugene.comms@ltimindtree.com.


