Key Performance Indicators
ON A SUSTAINED POSITIVE
TRAJECTORY
In FY25, we experienced steady revenue growth, driven by strong
demand for our AI and digital transformation services. Despite facing
margin pressures, we remain well-positioned for sustained success,
with positive momentum in business development.
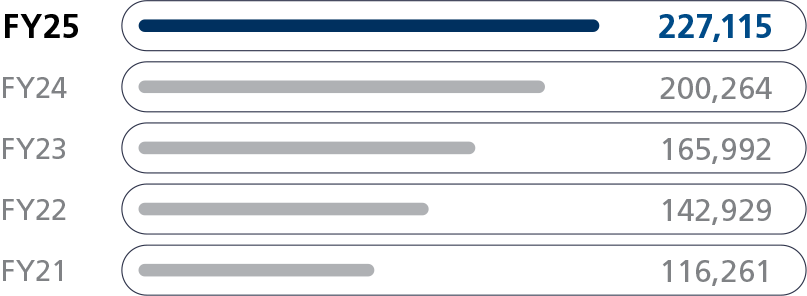
Net Worth
0
18.2% CAGR
(INR in Million)
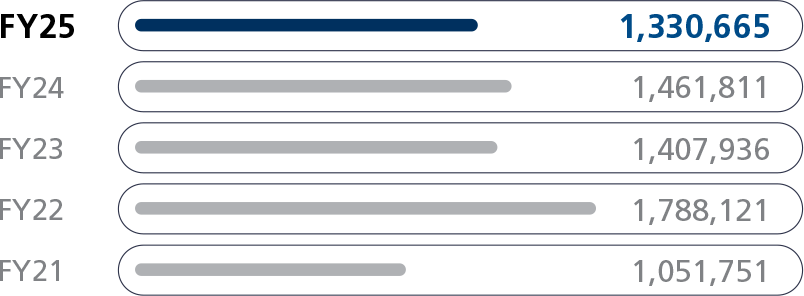
Market Capitalization
0
6.1% CAGR
(INR in Million)
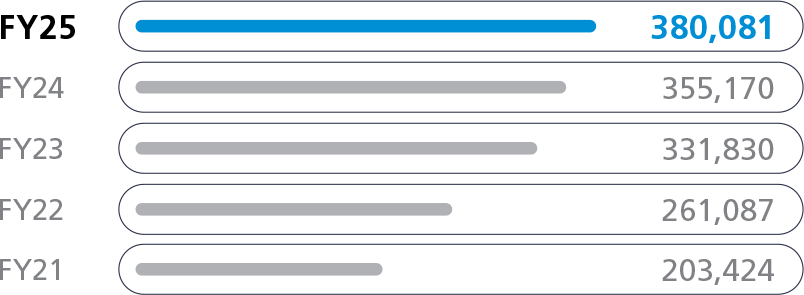
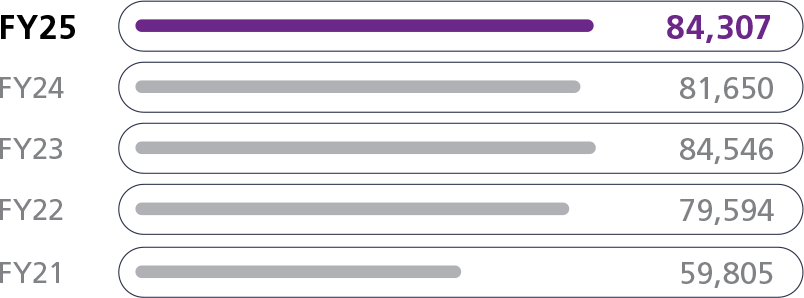
Revenue
0
16.9% CAGR
(INR in Million)
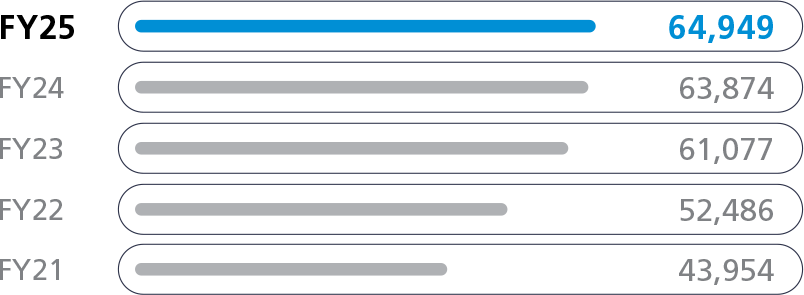
EBITDA
0
10.3% CAGR
(INR in Million)
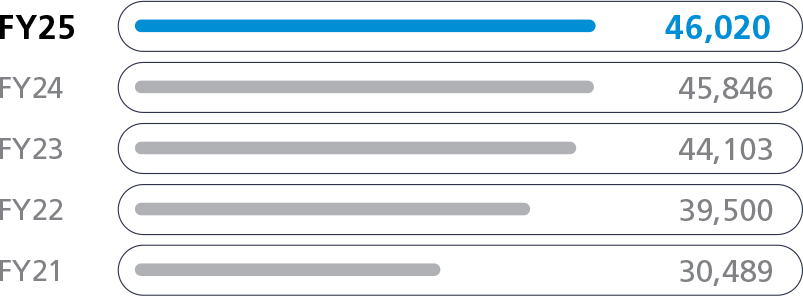
Profit After Tax
0
10.8% CAGR
(INR in Million)
CSR Spend
0
(INR in Million)
EPS (Basic)
0
10.7% CAGR
(INR)
EPS (Diluted)
0
10.8% CAGR
(INR)
Return on Equity
0
(in %)

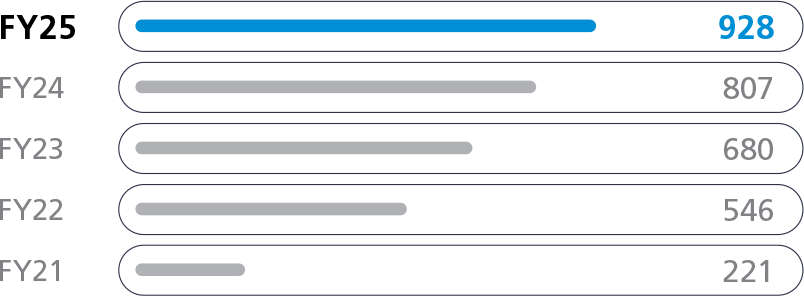
Dividend Paid
0
23.8% CAGR
(INR in Million)
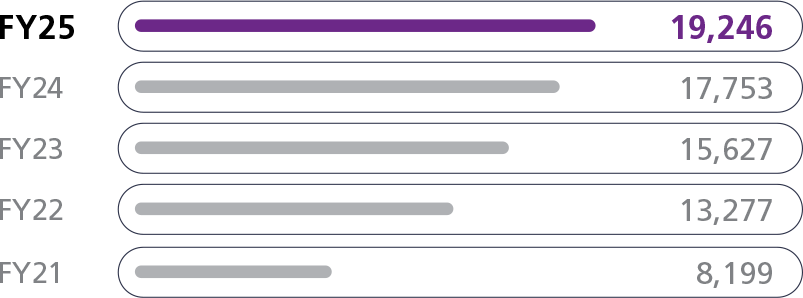
No. of Employees
0
© Copyright 2025 LTIMindtree Ltd. All rights reserved.
